Note
Go to the end to download the full example code.
Periodogram plot with traja
Plot periodogram or power spectrum with traja.plotting.plot_periodogram().
Wrapper for pandas scipy.signal.periodogram().
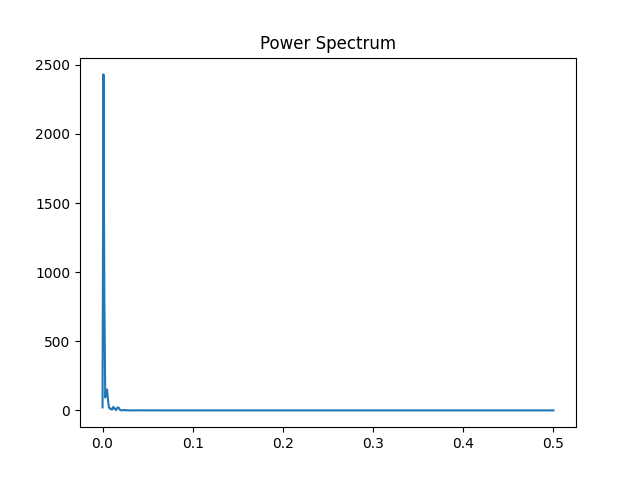
<Figure size 640x480 with 1 Axes>
import traja

trj = traja.generate(seed=0)
trj.traja.plot_periodogram('x')
Total running time of the script: (0 minutes 0.059 seconds)