Note
Go to the end to download the full example code.
Plotting trajectories on a grid
traja allows comparing trajectories using various methods.
import traja

df = traja.generate(seed=0)
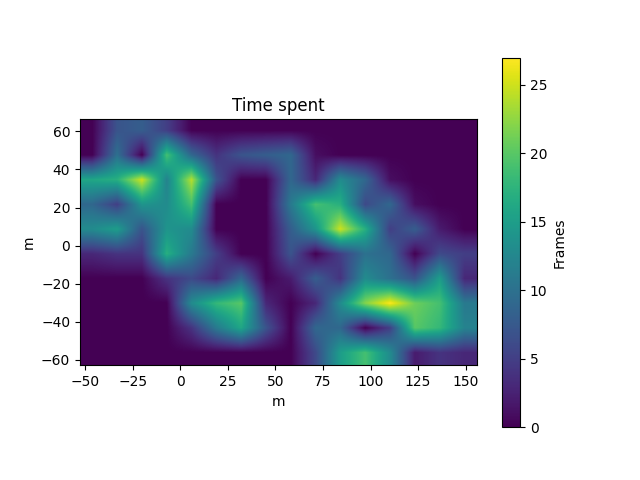
Plot a heat map of the trajectory
A heat map can be generated using trip_grid().
df.traja.trip_grid()
(array([[ 0.,  7.,  8.,  5.,  0.,  0.,  0.,  0.,  0.,  0.,  0.,  0.,  0.,
         0.,  0.,  0.],
       [ 0., 10.,  0., 19.,  9.,  4.,  7.,  8.,  9.,  1.,  0.,  0.,  0.,
         0.,  0.,  0.],
       [16., 17., 25., 12., 24.,  7.,  0.,  0.,  9.,  3., 13.,  9.,  1.,
         0.,  0.,  0.],
       [ 9.,  5., 14., 13., 19.,  0.,  0.,  0., 11., 19., 17.,  6.,  9.,
         1.,  0.,  0.],
       [13., 15.,  7., 14., 13.,  0.,  0.,  0.,  8., 14., 25., 17.,  5.,
         8.,  2.,  0.],
       [ 3.,  4.,  4., 17., 11.,  5.,  0.,  0.,  7.,  0.,  5., 10.,  9.,
         0.,  6.,  5.],
       [ 0.,  0.,  0.,  4.,  6.,  3.,  9.,  0.,  2.,  8.,  4., 13., 10.,
         7., 15.,  3.],
       [ 0.,  0.,  0.,  0., 13., 18., 20.,  3.,  0.,  3., 13., 22., 27.,
        21., 19., 11.],
       [ 0.,  0.,  0.,  0.,  4., 11., 16.,  7.,  0.,  9.,  9.,  0.,  5.,
        20., 18., 12.],
       [ 0.,  0.,  0.,  0.,  0.,  0.,  0.,  0.,  0.,  6., 15., 19., 13.,
         2.,  4.,  3.]]), <matplotlib.image.AxesImage object at 0x795026eba500>)
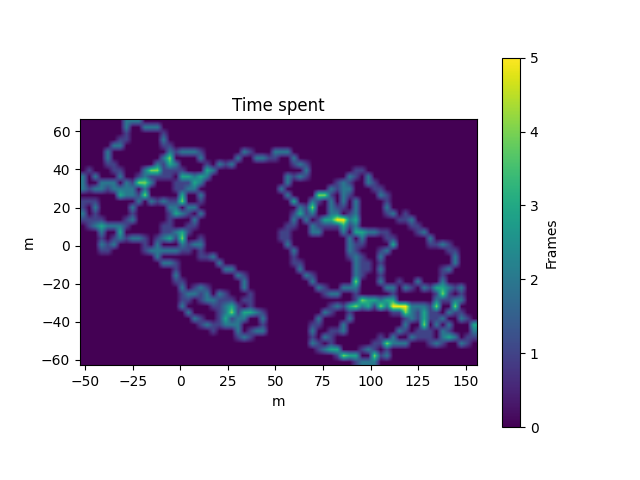
Increase the grid resolution
Number of bins can be specified with the bins parameter.
df.traja.trip_grid(bins=40)
(array([[0., 0., 0., ..., 0., 0., 0.],
       [0., 0., 0., ..., 0., 0., 0.],
       [0., 0., 0., ..., 0., 0., 0.],
       ...,
       [0., 0., 0., ..., 0., 0., 0.],
       [0., 0., 0., ..., 0., 0., 0.],
       [0., 0., 0., ..., 0., 0., 0.]], shape=(40, 64)), <matplotlib.image.AxesImage object at 0x795026c83490>)
Convert coordinates to grid indices
Number of x and y bins can be specified with the bins` parameter.
from traja.trajectory import grid_coordinates

grid_coords = grid_coordinates(df, bins=32)
print(grid_coords.head())
   xbin  ybin
0    12    15
1    13    15
2    13    16
3    13    16
4    13    17
Transitions as Markov first-order Markov model
Probability of transitioning between cells is computed using traja.trajectory.transitions().
transitions_matrix = traja.trajectory.transitions(df, bins=32)
print(transitions_matrix[:10])
[[0. 0. 0. ... 0. 0. 0.]
 [0. 0. 0. ... 0. 0. 0.]
 [0. 0. 0. ... 0. 0. 0.]
 ...
 [0. 0. 0. ... 0. 0. 0.]
 [0. 0. 0. ... 0. 0. 0.]
 [0. 0. 0. ... 0. 0. 0.]]
Total running time of the script: (0 minutes 0.408 seconds)