Note
Go to the end to download the full example code.
3D Plotting with traja
Plot trajectories with time in the vertical axis.
Note: Adjust matplotlib args dist, labelpad, aspect and adjustable`
as needed.
import traja

df = traja.TrajaDataFrame({"x": [0, 1, 2, 3, 4], "y": [1, 3, 2, 4, 5]})
trj = traja.generate(seed=0)
Plot a trajectory in 3D
A 3D plot is generated using plot_3d().
trj.traja.plot_3d(dist=15, labelpad=32, title="Traja 3D Plot")
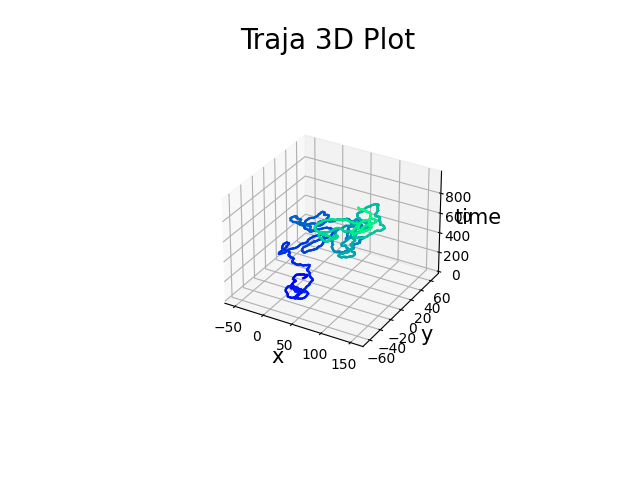
<Axes3D: title={'center': 'Traja 3D Plot'}, xlabel='x', ylabel='y', zlabel='time'>
Total running time of the script: (0 minutes 1.452 seconds)