Note
Go to the end to download the full example code.
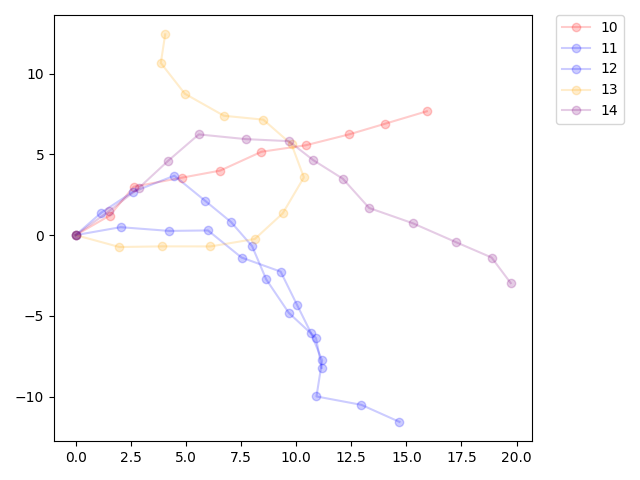
Plotting Multiple Trajectories
Plotting multiple trajectories is easy with plot().
import traja
from traja import TrajaCollection

# Create a dictionary of DataFrames, with 'id' as key.
dfs = {idx: traja.generate(idx, seed=idx) for idx in range(10, 15)}

# Create a TrajaCollection.
trjs = TrajaCollection(dfs)

# Note: A TrajaCollection can also be instantiated with a DataFrame, containing and id column,
# eg, TrajaCollection(df, id_col="id")

# 'colors' also allows substring matching, eg, {"car":"red", "person":"blue"}
lines = trjs.plot(
    colors={10: "red", 11: "blue", 12: "blue", 13: "orange", 14: "purple"}
)
Total running time of the script: (0 minutes 0.113 seconds)