Note
Go to the end to download the full example code.
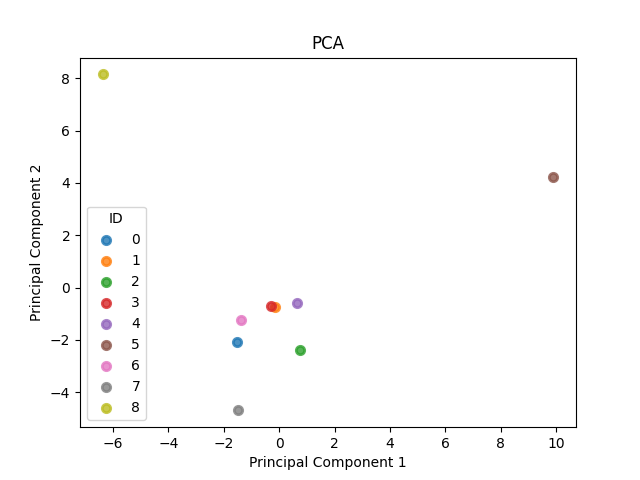
Plot PCA with traja
Plot PCA of a trip grid with traja.plotting.plot_pca()
<Figure size 640x480 with 1 Axes>
Total running time of the script: (0 minutes 0.280 seconds)
Note
Go to the end to download the full example code.
Plot PCA of a trip grid with traja.plotting.plot_pca()
<Figure size 640x480 with 1 Axes>
Total running time of the script: (0 minutes 0.280 seconds)