Plotting Grid Cell Flow
Trajectories can be discretized into grid cells and the average flow from
each grid cell to its neighbor can be plotted with plot_flow(), eg:
traja.plot_flow(df, kind='stream')
plot_flow() kind Arguments
surface - 3D surface plot extending
mpl_toolkits.mplot3D.Axes3D.plot_surface`()contourf - Filled contour plot extending
matplotlib.axes.Axes.contourf()quiver - Quiver plot extending
matplotlib.axes.Axes.quiver()stream - Stream plot extending
matplotlib.axes.Axes.streamplot()
See the gallery for more examples.
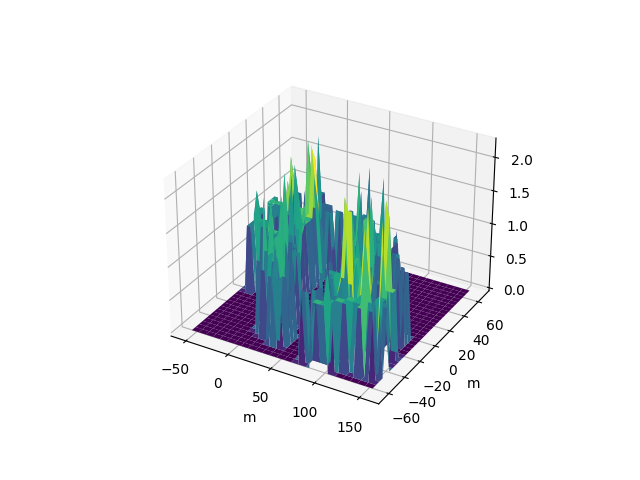
3D Surface Plot
- traja.plotting.plot_surface(trj: TrajaDataFrame, bins: int | tuple | None = None, cmap: str = 'viridis', **surfaceplot_kws: dict) Figure[source]
Plot surface of flow from each grid cell to neighbor in 3D.
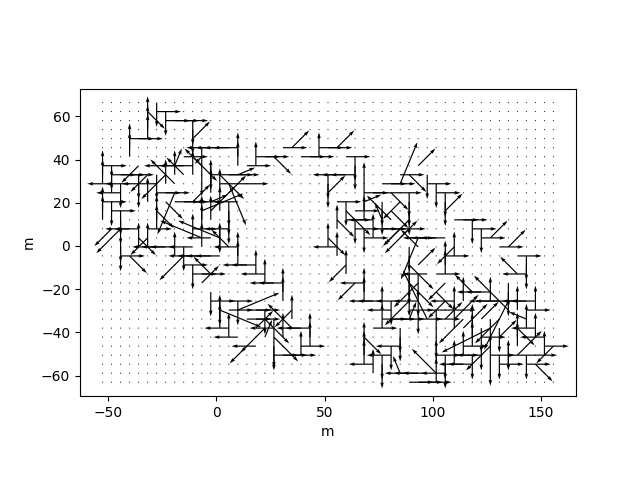
Quiver Plot
- traja.plotting.plot_quiver(trj: TrajaDataFrame, bins: int | tuple | None = None, quiverplot_kws: dict = {}, **kwargs) Axes[source]
Plot average flow from each grid cell to neighbor.
traja.plot_quiver(df, bins=32)
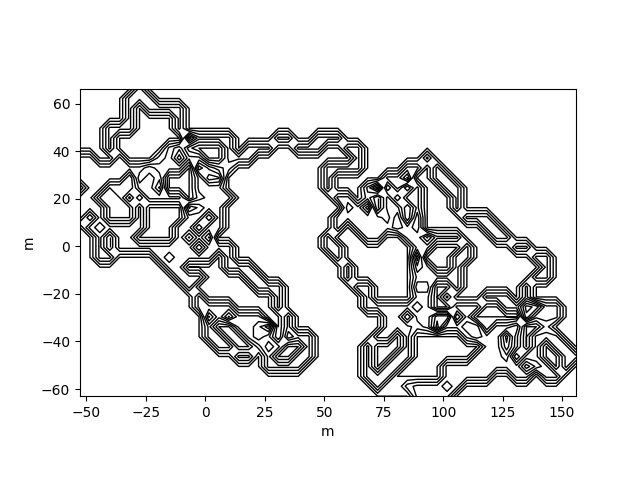
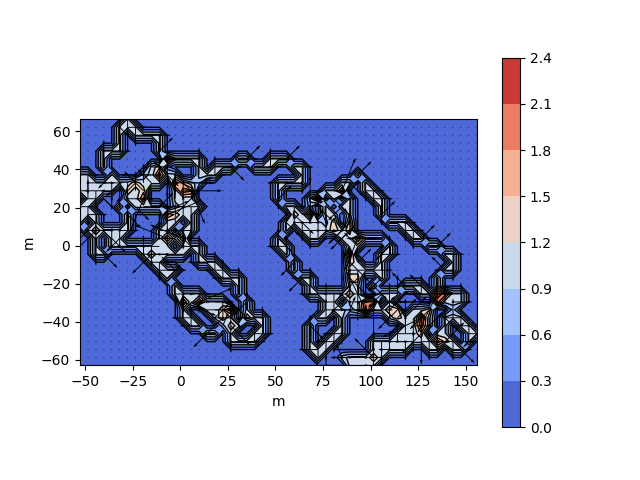
Contour Plot
- traja.plotting.plot_contour(trj: TrajaDataFrame, bins: int | tuple | None = None, filled: bool = True, quiver: bool = True, contourplot_kws: dict = {}, contourfplot_kws: dict = {}, quiverplot_kws: dict = {}, ax: Axes | None = None, **kwargs) Axes[source]
Plot average flow from each grid cell to neighbor.
- Parameters:
trj – Traja DataFrame
bins (int or tuple) – Tuple of x,y bin counts; if bins is int, bin count of x, with y inferred from aspect ratio
filled (bool) – Contours filled
quiver (bool) – Quiver plot
contourplot_kws – Additional keyword arguments for
contour()contourfplot_kws – Additional keyword arguments for
contourf()quiverplot_kws – Additional keyword arguments for
quiver()ax (optional) – Matplotlib Axes
- Returns:
Axes of quiver plot
- Return type:
ax (
Axes)
traja.plot_contour(df, filled=False, quiver=False, bins=32)
Contour Plot (Filled)
traja.plot_contour(df, filled=False, quiver=False, bins=32)
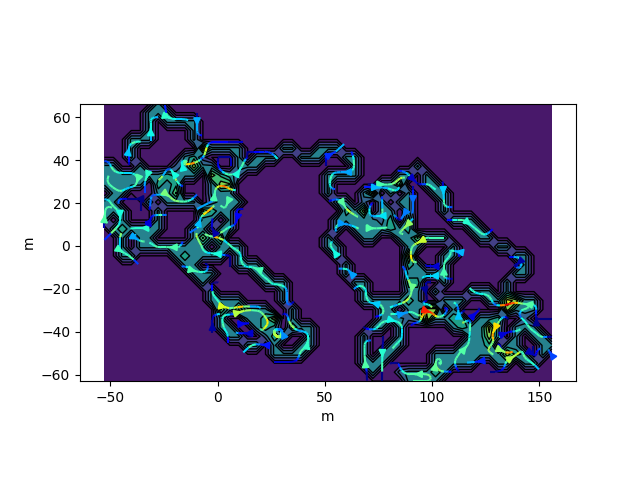
Stream Plot
- traja.plotting.plot_stream(trj: TrajaDataFrame, bins: int | tuple | None = None, cmap: str = 'viridis', contourfplot_kws: dict = {}, contourplot_kws: dict = {}, streamplot_kws: dict = {}, **kwargs) Figure[source]
Plot average flow from each grid cell to neighbor.
- Parameters:
bins (int or tuple) – Tuple of x,y bin counts; if bins is int, bin count of x, with y inferred from aspect ratio
contourplot_kws – Additional keyword arguments for
contour()contourfplot_kws – Additional keyword arguments for
contourf()streamplot_kws – Additional keyword arguments for
streamplot()
- Returns:
Axes of stream plot
- Return type:
ax (
Axes)
traja.plot_contour(df, bins=32, contourfplot_kws={'cmap':'coolwarm'})