Plotting Paths
Making plots of trajectories is easy using the plot() method.
See the gallery for more examples.
- traja.plotting.bar_plot(trj: TrajaDataFrame, bins: Optional[Union[int, tuple]] = None, **kwargs) Axes[source]
Plot trajectory for single animal over period.
- Parameters
- Returns
Axes of plot
- Return type
ax (
PathCollection)
- traja.plotting.plot(trj: TrajaDataFrame, n_coords: Optional[int] = None, show_time: bool = False, accessor: Optional[TrajaAccessor] = None, ax=None, **kwargs) PathCollection[source]
Plot trajectory for single animal over period.
- Parameters
trj (
traja.TrajaDataFrame) – trajectoryn_coords (int, optional) – Number of coordinates to plot
show_time (bool) – Show colormap as time
accessor (
TrajaAccessor, optional) – TrajaAccessor instanceax (
Axes) – axes for plottinginteractive (bool) – show plot immediately
**kwargs – additional keyword arguments to
matplotlib.axes.Axes.scatter()
- Returns
collection that was plotted
- Return type
collection (
PathCollection)
- traja.plotting.plot_actogram(series: Series, dark=(19, 7), ax: Optional[Axes] = None, **kwargs)[source]
Plot activity or displacement as an actogram.
Note
For published example see Eckel-Mahan K, Sassone-Corsi P. Phenotyping Circadian Rhythms in Mice. Curr Protoc Mouse Biol. 2015;5(3):271-281. Published 2015 Sep 1. doi:10.1002/9780470942390.mo140229
- traja.plotting.plot_contour(trj: TrajaDataFrame, bins: Optional[Union[int, tuple]] = None, filled: bool = True, quiver: bool = True, contourplot_kws: dict = {}, contourfplot_kws: dict = {}, quiverplot_kws: dict = {}, ax: Optional[Axes] = None, **kwargs) Axes[source]
Plot average flow from each grid cell to neighbor.
- Parameters
trj – Traja DataFrame
bins (int or tuple) – Tuple of x,y bin counts; if bins is int, bin count of x, with y inferred from aspect ratio
filled (bool) – Contours filled
quiver (bool) – Quiver plot
contourplot_kws – Additional keyword arguments for
contour()contourfplot_kws – Additional keyword arguments for
contourf()quiverplot_kws – Additional keyword arguments for
quiver()ax (optional) – Matplotlib Axes
- Returns
Axes of quiver plot
- Return type
ax (
Axes)
- traja.plotting.plot_flow(trj: TrajaDataFrame, kind: str = 'quiver', *args, contourplot_kws: dict = {}, contourfplot_kws: dict = {}, streamplot_kws: dict = {}, quiverplot_kws: dict = {}, surfaceplot_kws: dict = {}, **kwargs) Figure[source]
Plot average flow from each grid cell to neighbor.
- Parameters
bins (int or tuple) – Tuple of x,y bin counts; if bins is int, bin count of x, with y inferred from aspect ratio
kind (str) – Choice of ‘quiver’,’contourf’,’stream’,’surface’. Default is ‘quiver’.
contourplot_kws – Additional keyword arguments for
contour()contourfplot_kws – Additional keyword arguments for
contourf()streamplot_kws – Additional keyword arguments for
streamplot()quiverplot_kws – Additional keyword arguments for
quiver()surfaceplot_kws – Additional keyword arguments for
plot_surface()
- Returns
Axes of plot
- Return type
ax (
Axes)
- traja.plotting.plot_quiver(trj: TrajaDataFrame, bins: Optional[Union[int, tuple]] = None, quiverplot_kws: dict = {}, **kwargs) Axes[source]
Plot average flow from each grid cell to neighbor.
- traja.plotting.plot_stream(trj: TrajaDataFrame, bins: Optional[Union[int, tuple]] = None, cmap: str = 'viridis', contourfplot_kws: dict = {}, contourplot_kws: dict = {}, streamplot_kws: dict = {}, **kwargs) Figure[source]
Plot average flow from each grid cell to neighbor.
- Parameters
bins (int or tuple) – Tuple of x,y bin counts; if bins is int, bin count of x, with y inferred from aspect ratio
contourplot_kws – Additional keyword arguments for
contour()contourfplot_kws – Additional keyword arguments for
contourf()streamplot_kws – Additional keyword arguments for
streamplot()
- Returns
Axes of stream plot
- Return type
ax (
Axes)
- traja.plotting.plot_surface(trj: TrajaDataFrame, bins: Optional[Union[int, tuple]] = None, cmap: str = 'viridis', **surfaceplot_kws: dict) Figure[source]
Plot surface of flow from each grid cell to neighbor in 3D.
- traja.plotting.polar_bar(trj: TrajaDataFrame, feature: str = 'turn_angle', bin_size: int = 2, threshold: float = 0.001, overlap: bool = True, ax: Optional[Axes] = None, **plot_kws: str) Axes[source]
Plot polar bar chart.
- Parameters
- Returns
Axes of plot
- Return type
ax (
PathCollection)
Trip Grid
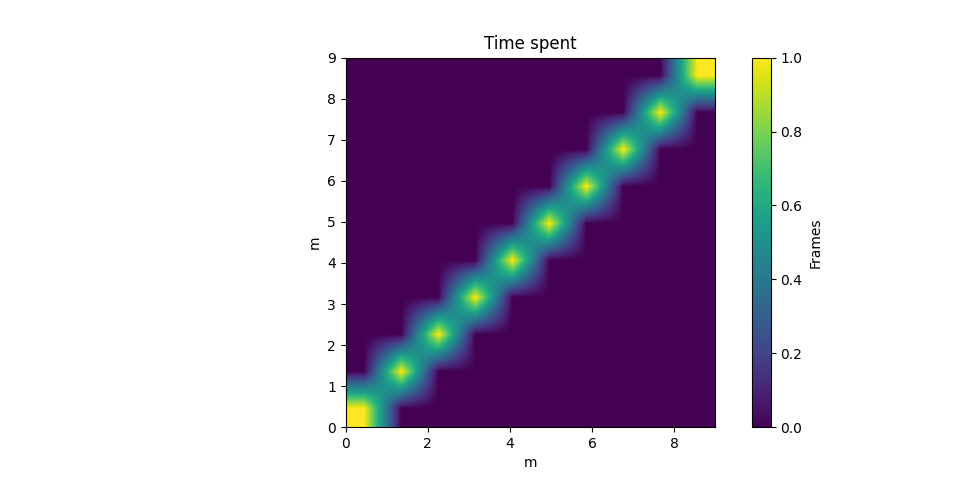
Trip grid can be plotted for trip_grid:
In [1]: import traja

In [2]: from traja import trip_grid

In [3]: df = traja.TrajaDataFrame({'x':range(10),'y':range(10)})

In [4]: hist, image = trip_grid(df);
If only the histogram is need for further computation, use the hist_only option:
In [5]: hist, _ = trip_grid(df, hist_only=True)

In [6]: print(hist[:5])
[[0. 0. 0. 0. 0. 0. 0. 0. 0. 1.]
 [0. 0. 0. 0. 0. 0. 0. 0. 1. 0.]
 [0. 0. 0. 0. 0. 0. 0. 1. 0. 0.]
 [0. 0. 0. 0. 0. 0. 1. 0. 0. 0.]
 [0. 0. 0. 0. 0. 1. 0. 0. 0. 0.]]
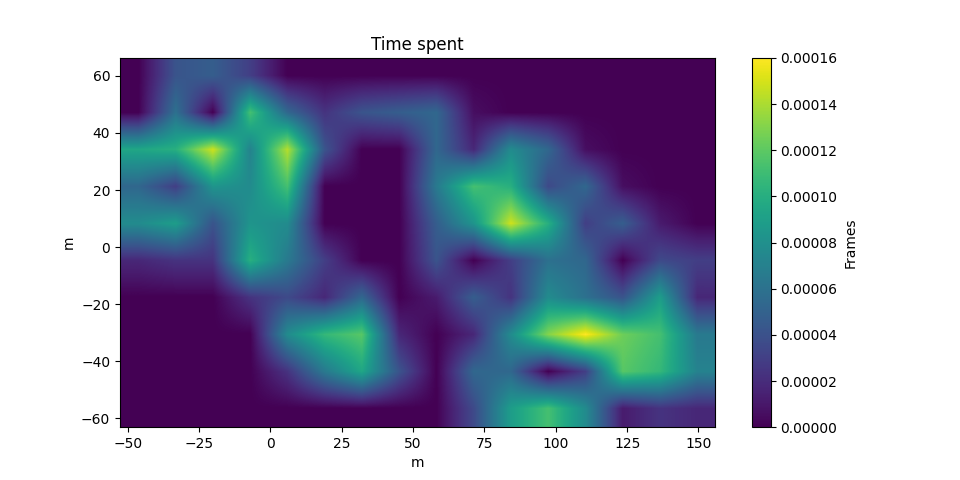
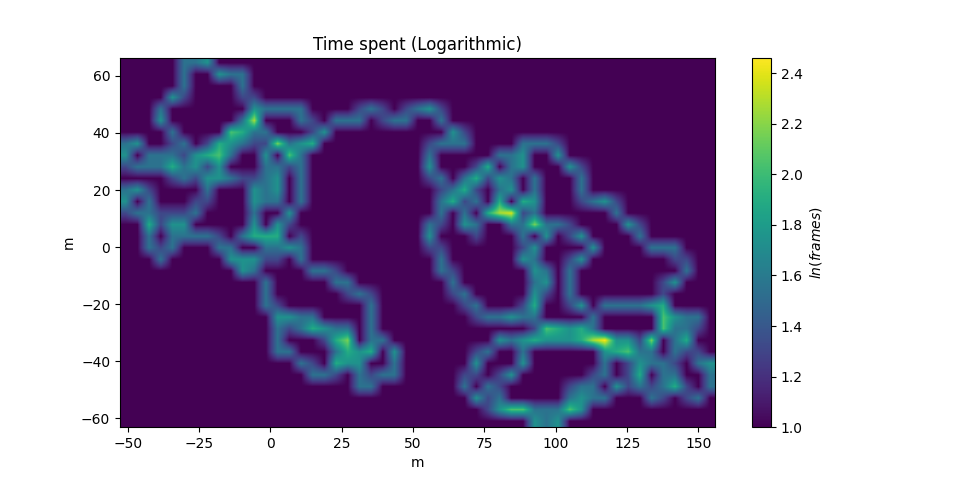
Highly dense plots be more easily visualized using the bins and log argument:
# Generate random walk
In [7]: df = traja.generate(1000)

In [8]: trip_grid(df, bins=32, log=True);
The plot can also be normalized into a density function with normalize:
In [9]: hist, _ = trip_grid(df, normalize=True);