Periodicity
Several methods for analyzing periodicity are included.
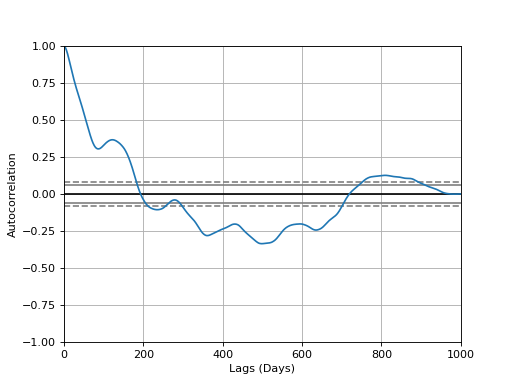
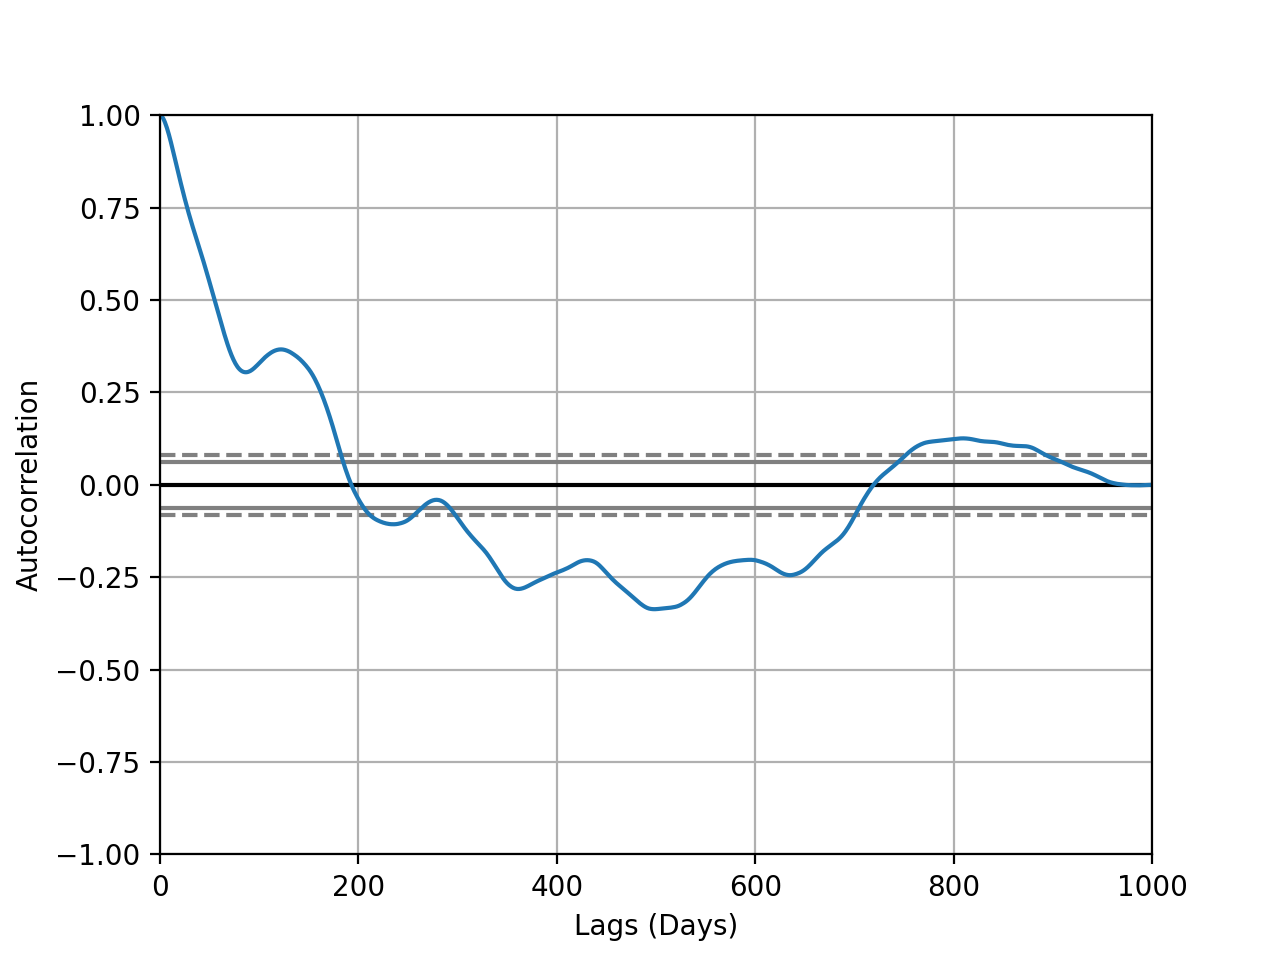
Autocorrelation
Autocorrelation is plotted using pandas.plotting.autocorrelation_plot().
- traja.plotting.plot_autocorrelation(trj: TrajaDataFrame, coord: str = 'y', unit: str = 'Days', xmax: int = 1000, interactive: bool = True)[source]
Plot autocorrelation of given coordinate.
- Parameters
Trajectory (trj -) –
'y' (coord - 'x' or) –
string (unit -) –
eg –
'Days' –
value (xmax - max xaxis) –
immediately (interactive - Plot) –
- Returns
Matplotlib Figure
(Source code, png, hires.png, pdf)

Note
Convenience wrapper for pandas
autocorrelation_plot().
Periodogram (Power Spectum)
Convenience wrapper for scipy.signal.periodogram().
- traja.plotting.plot_periodogram(trj, coord: str = 'y', fs: int = 1, interactive: bool = True)[source]
Plot power spectral density of
coordtimeseries using a periodogram.- Parameters
Trajectory (trj -) –
'y' (coord - choice of 'x' or) –
frequency (fs - Sampling) –
immediately (interactive - Plot) –
- Returns
Figure
Note
Convenience wrapper for
scipy.signal.periodogram().